Sigma is a relatively newcomer in the data analytics and data visualisation product space. In this article, Snap’s very own Sigma Certified and data visualisation wizard Fergus Ustianowski answers the top 10 of Frequentyly Asked Questions from our customers.
What is Sigma?
Embark on a transformative journey into the realm of data analytics with Sigma Computing—an innovative tool originating from the United States. This Software as a Service (SaaS) solution stands out with its intuitive, tabular-based interface, promising an unparalleled user experience in the dynamic landscape of data visualisation.
What can I connect Sigma to?
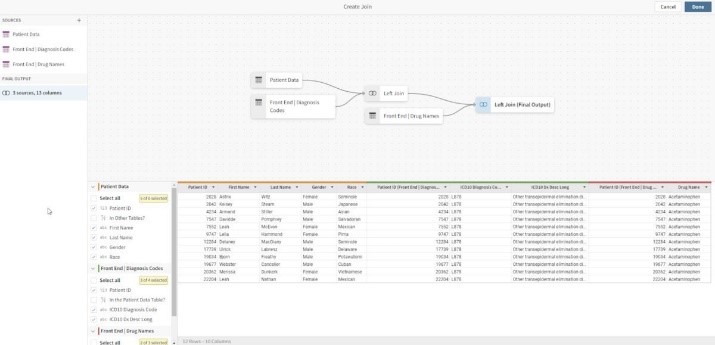
Sigma excels in data preparation with robust features such as seamless joins, unions, and simplified data cleaning through column edits and calculations. The platform empowers users to aggregate data, create reusable metrics, and ensure enhanced efficiency and consistency. Sigma’s security protocols, aligned with warehouse security roles, ensure seamless transitions across software environments. Sigma does not have the advanced Extract, Transform and Load capabilities for data engineers, but offers extremely powerful data transformation capabilities for self-service users.

How much does Sigma cost?
Sigma operates on a user-centric payment model, featuring a platform fee and charges for pro users, offering a transparent pricing structure. Notably, viewer licenses come at no additional cost, making Sigma an ideal choice for organizations requiring extensive viewer licensing, such as those aiming to keep clients informed on project progress. The platform’s intelligent caching mechanism ensures that despite pushing calculations down to the warehouse level, there is no disproportionate increase in warehouse credits, providing cost predictability and efficiency. This unique approach enhances Sigma’s appeal as a budget-friendly solution without compromising on its powerful data visualisation capabilities.
What visualisations am I able to use?
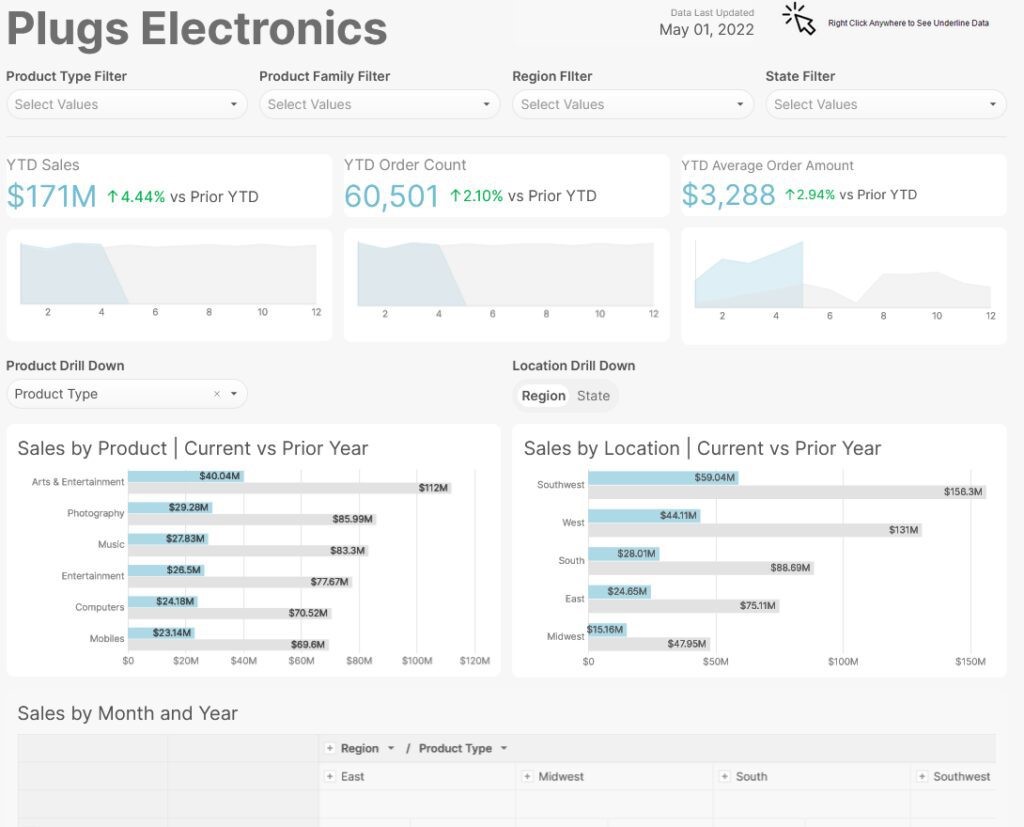
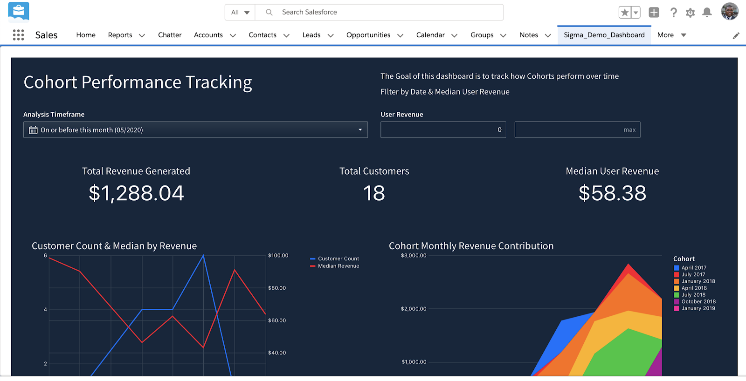
Sigma offers a diverse array of visualisation types, it offers the expected visualisations of an enterprise BI tool, not dissimilar to PowerBI, but it has interesting graphs like Sankey and extensive geo charts which are not yet standard in PowerBI. Unique features include linked input tables for interactive data insertion, web page embeds, and date range slicers, with an added ability to automatically calculate rolling time periods—a feature often challenging in other data visualisation tools.
How easy is it for non-technology proficient people to pick it up?
Setting a benchmark for user-friendly interfaces, Sigma caters to non-technical users with its familiar spreadsheet-like layout and calculations resembling Excel. The platform facilitates the creation of complex dashboards using low-code objects, contributing to its high adoption and retention rates in the competitive data visualisation market.

What is the AI integration like?
Powered by OpenAI, Sigma’s AI integration introduces a layer of intelligence to data analytics, offering capabilities such as classification, sentiment analysis (opinion mining), and data synthesis (filling any gaps in the data). This integration elevates data interpretation and provides valuable insights for informed decision-making. I found especially the sentiment analysis easy to add rich content to any dashboards.
How do I share the dashboards?
Sigma simplifies the process of sharing reports, whether it’s direct sharing within the platform or embedding reports into websites using iframes, Sigma ensures a seamless and efficient sharing experience. Additionally, Sigma’s online portal embedding function allows integration into web pages, enhancing accessibility. This versatile approach accommodates diverse user preferences and ensures that data insights can be effortlessly communicated across various channels. Furthermore, with viewer licensing being entirely free, the platform facilitates widespread adoption and collaboration, making Sigma a cost-effective and user-friendly choice for organizations seeking to share critical dashboards with stakeholders, clients, and teams.

Why Sigma over other data visualisation software?
Sigma stands as the optimal choice for organizations seeking a powerful yet user-friendly data visualisation tool. Its intuitive interface, reminiscent of familiar spreadsheets, and a low-code approach make it accessible for users with varying technical expertise, fostering high adoption rates. Sigma’s affordability, approximately half the price of comparable tools like Tableau, provides significant cost advantages, particularly for large-scale enterprises.
Moreover, Sigma facilitates seamless collaboration, allowing team members to work concurrently on impactful visualisation. By replacing complex DAX code with a user-friendly approach, Sigma streamlines dashboard creation, empowering users with diverse skill sets. In essence, Sigma delivers cost-effectiveness, collaboration, and accessibility, making it a comprehensive competitor to PowerBI.
How do I find out more about how Sigma can with my data analytics and visualisation requirements?
Snap Analytics provides unbiased advice about which data & analytics tools are the best match for a specific customer, based on their unique requirements. Analytics is our core business, and we have a long track record of success with a wide variety of applications. Snap is a Sigma partner, and we have certified Sigma consultants who can help you demonstrate the value of Sigma for your organisation. Get in touch with the Snap team to discuss how we can help making your data & analytics journey a success.


