Once upon a time when the world was young, people got around by remembering landmarks, looking at the stars and making the occasional lucky guess. For the most part they didn’t have far to travel so taking a wrong turn here or there did not mean getting lost forever. Until recently, the business world was a bit like this too, with people relying on assumptions about their customers and acting on hunches based on past experience.
But now we’re living in a globally connected society and operating in a sophisticated data driven landscape where chances are, if you rely too heavily on your nose and just hope for the best you’re going to get badly lost. Thankfully analytics can help, whether you’re tracking sales or avoiding traffic jams in an unknown neighbourhood.
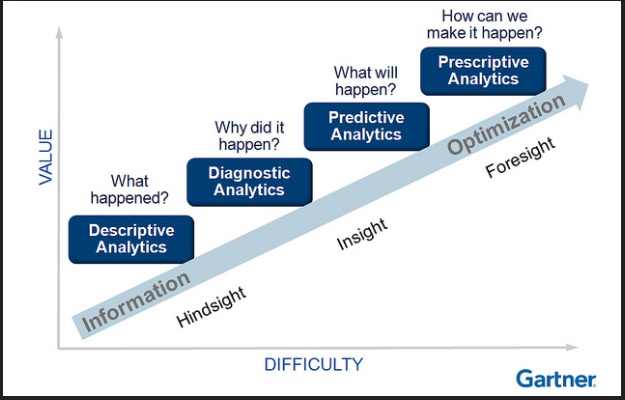
The process exists on what we call a ‘maturity curve’, a four part journey which takes us from the most basic statistics to a process driven entirely by AI. Understanding the different stages will give you an idea of how the business of analytics works and will help you plot a course for your business. Gartner’s model helps to visualise the analytics journey:

Descriptive: Say what happened
One day people got sick of walking through the woods, taking a wrong path and stumbling across a sloth of angry bears. After returning to their cabin and counting their remaining limbs they decided to begin to chart those woods and eventually the rest of the world around them.
Diagnostic: Why did it happen?
Without accurate maps, unpleasant bear encounters seemed inevitable. But once people began to join up all their fragments, accurate maps began to appear. People got lost far less and the bears were left to get on with whatever it is that bears do.
So it was in business that people began to make accurate records of their sales which they used year on year to measure growth and diagnose where their problems were. In data analytics this is known as ‘descriptive analysis’ and it is the bedrock of understanding your business.
Predictive: What’s going to happen?
The paper maps were all well and good but what if you hit road works and need to stray beyond the confines of your usual route? SatNav provided the solution, removing the need even for basic wayfinding skills – it simply tells you where to go.
This is how the second ‘predictive’ stage on the maturity curve functions. It combines the historical (descriptive) data with current variables that may affect your business, things like weather or an influx of tourists; it then accurately predicts how your business will fare in the months and years ahead.
Prescriptive: What do I need to do?
Now you no longer need to worry about how to get somewhere and your fancy SatNav can even tell you what time you will arrive. The next stage involves removing the need to even engage in the mechanical process of driving as all that crucial information is accessed by a driverless car that makes all the key decisions for you. Traffic jam forming up ahead? Sit back and relax while it swerves past the accident takes you the scenic route through the woods (don’t forget to wave to the bears).
The final ‘prescriptive’ stage of the maturity process offers you the ability to hand over more and more business decisions to AI. So, for example if you sell ice cream, the data will look at the weather forecast and automatically send extra stock to shops in areas where there is a heatwave. And when you reach the top of the maturity curve the system can be set up to read a huge variety of cues and make automated decisions right across your business.
In analytics – as in life – there are no shortcuts to reaching the top of the curve. It is a long and sometimes difficult journey. But thanks to technology it is becoming increasingly rewarding, if done right.


