Chatbots are becoming increasingly popular with users globally. In fact, they’re so popular that ChatGPT alone receives over 2.5 billion prompts per day1. The development of generative AI (GenAI) created the concept of generative BI, referring to the application of GenAI in business intelligence use cases. Bringing business intelligence and AI together opens the possibility for users to ask natural-language questions and receive meaningful visual and textual insights in return (see Figure 1). To build a reliable system, however, well-structured data and an effective AI agent, which produces appropriate and reliable visualisations, need to be in place. In this article, we will look at how a chatbot is built to help business users find the answers they need and reduce manual work for data visualisation experts. This is an introductory article on the topic.
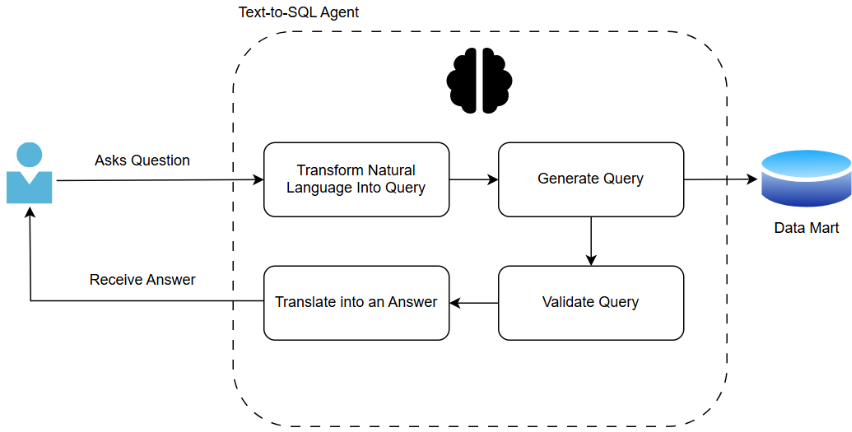
Figure 1. A diagram of user interaction with an agent
The process starts with establishing a well-constructed data mart. This step helps to reduce errors, improve performance, and increase confidence in the results. The data that the bot queries, should follow standard data-quality rules.
If we take the following case study as an example: we are a data visualisation expert working with a record label company that has two years of data on global music sales, records, and artist databases (see Figure 2). We need to ensure the data are clean and complete. There should be no missing time periods or unexpected NULLs. Data types should be correctly assigned and consistent, and duplicate records should be removed. As an extra step, data can be aggregated to speed up querying. For instance, daily transactions can be summed into daily and monthly sales totals by artist_id. This makes it much easier for the agent to answer questions such as “What were our physical sales in the UK last quarter?” or to look ahead and “Make a prognosis for sales in the UK next quarter.” Column names should be meaningful and follow rules agreed by your team or organisation.
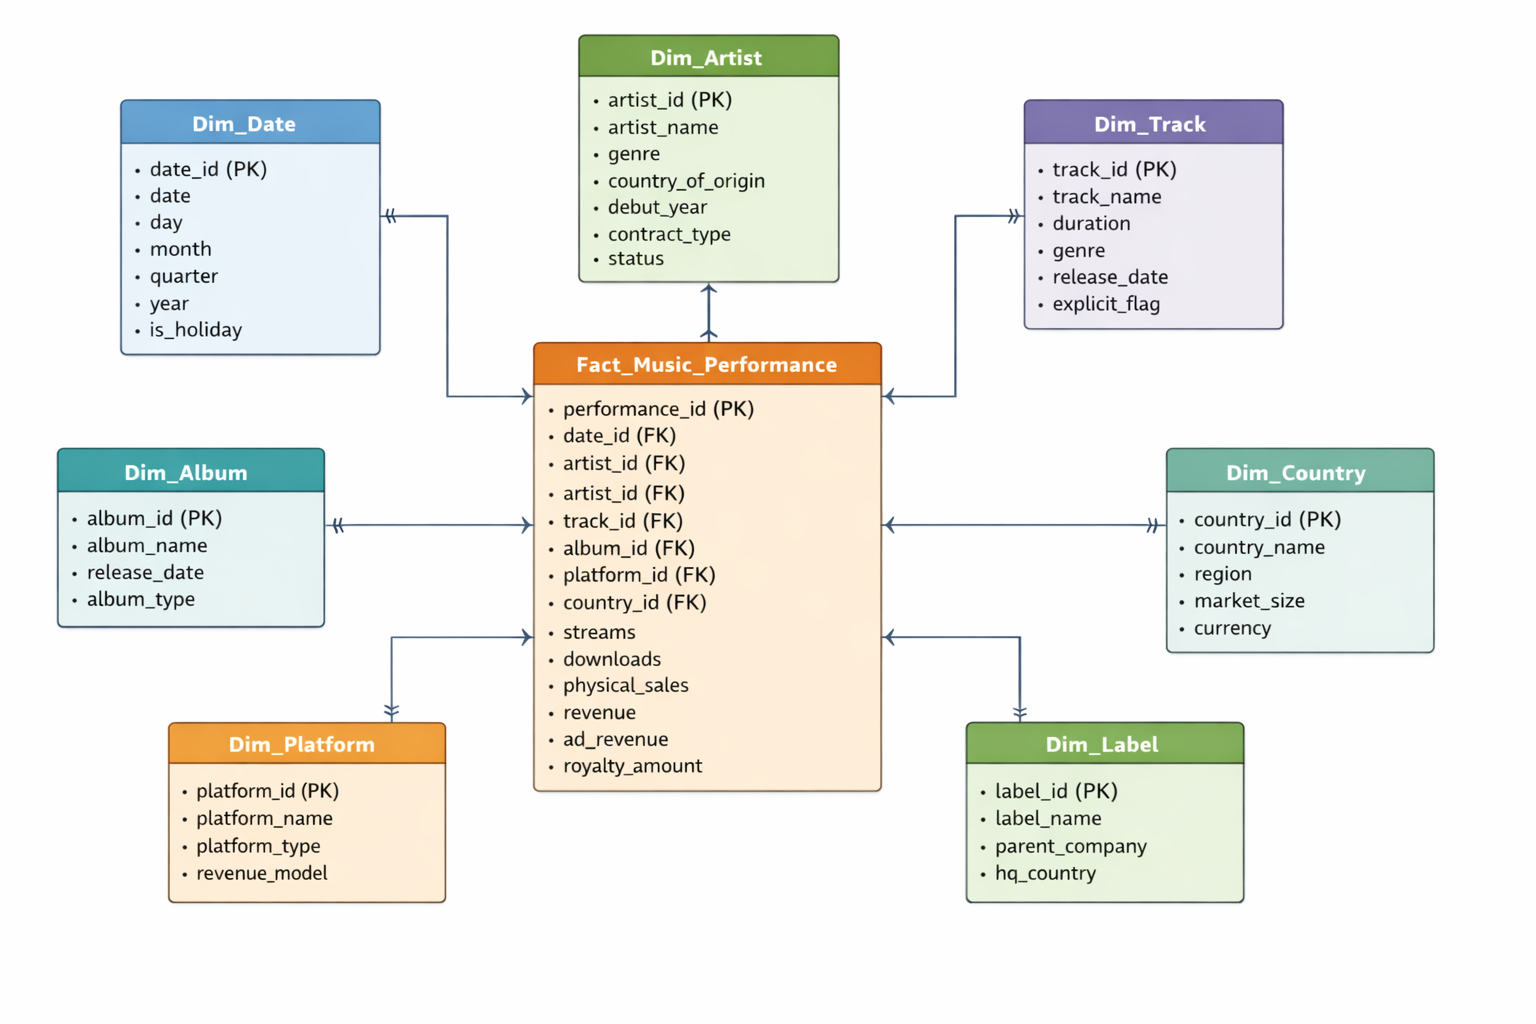
Figure 2. ER Diagram of an example database of a record label company
Next, consider building a strong ontology. In our day-to-day lives, we refer to things using different synonyms and expressions. To help computers understand us, we need an ontology. Using our example, we might ask, “What were our physical sales in the UK last quarter?”. Sales could refer to the “revenue” or the “physical_sales” column. To remedy this confusion, we can add instructions for the computer in a separate file with column definitions to help ensure consistent answers. For instance, we could say that sales are equal to revenue, and physical sales refer to music sales in physical formats such as CDs, vinyl records, and cassette tapes. In addition to a description of each table and column, the ontology can provide key metric calculations, as well as business terms and acronym definitions. A list of sample natural-language questions and their corresponding SQL queries can be created in a vector database.
With a robust data mart and ontology, we can focus on the core of generative AI: the text-to-SQL agent. The text-to-SQL agent is powered by an LLM that translates business language into technical queries. The model does not generate SQL freely; instead, it is guided by the schema, ontology, and validation rules. A user prompt could look like this:
“You are an agent created to interact with a SQL database. Understand each question in its business context and use the company’s approved data definitions and schema. Rely on the semantic layer to interpret metrics and filters. Ask for clarification when a request is ambiguous. Generate accurate and efficient SQL using authorized tables and best practices, and do not access restricted data. Review all queries and results for correctness and reasonableness and flag unusual outputs or uncertainty before output. Select clear and appropriate visualisations based on established data visualisation principles and provide concise explanations that highlight.”
If we ask the question, “What were our sales in the UK last quarter?”, the agent will look up the keywords:
- Sales
- UK
- Quarter
It will then create a SQL query:
SELECT SUM(p.revenue)
FROM fact_music_performance p
LEFT JOIN dim_country c
ON p.country_id = c.country_id
LEFT JOIN dim_date d
ON p.date_id = d.date_id
WHERE c.country_name = “United Kingdom”
AND d.year = “2025”
AND d.quarter = “Q4”
If previous users have already asked the question, or it is stored as an example question, the agent will retrieve the answer directly, ensuring a reliable answer every time. When users ask questions that involve predictions, the agent follows a different path. It identifies what type of prediction needs to be made and links to a pre-trained model or statistical forecasts. The agent then applies the same validation checks before producing the output.
Before retrieving results, the agent validates the SQL code, checking syntax, table access, and sensitive data. The agent also applies rules (e.g., revenue can’t be negative, IDs can’t have spaces, dates must be current or past) and, if needed, rewrites and reruns queries. This validation ensures accuracy and security of responses. The agent further checks for unusual answers, like abnormally low quarterly sales, and can alert users.
Before delivering an answer, the text-to-SQL agent chooses how to present the result, using rules and learned patterns. Time-related terms prompt a line chart; category-based queries like “Top 5 most streamed artists” suggest a bar chart. The agent also considers axis types, data ranges, and previous user preferences from chat history when selecting visuals.
Creating an AI agent might seem daunting; however, with the right steps, it can be built quickly and produce efficient, correct results, saving companies time and effort. For business users, such a tool provides faster access to insights. For data visualisation analysts, less time is spent on manual tasks, and more time is spent on the business problem, as well as on developing their expertise in AI.
References:
1. Roth, E. (2025). OpenAI says ChatGPT users send over 2.5 billion prompts every day. [online] The Verge. Available at: https://www.theverge.com/news/710867/openai-chatgpt-daily-prompts-2-billion.