Recap
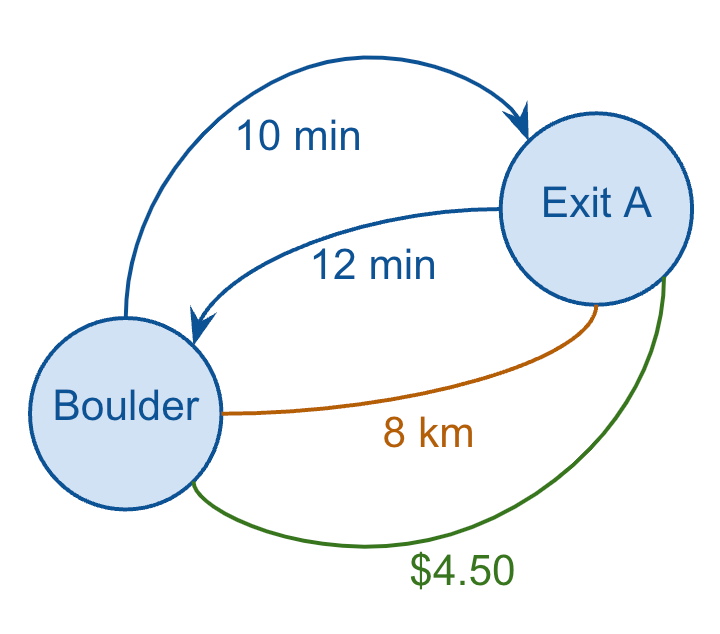
In the first post of this series, I walked through the basic ideas of what constitutes a graph with a simplified example from supply chain logistics.
To briefly recap:
- A graph consists of one or more nodes, which are connect to one another via one or more edges.
- A graph has a cycle if a node can reach itself by traversing the graph in a single direction.
- A given edge can be directed or undirected.
- Nodes and edges often represent real-world objects with various associated attributes.
- Graphs, nodes and edges can be modeled in relational databases.
This next post will further flesh out the technical context for hierarchies by exploring a subset of graphs called directed acyclic graphs (DAGs) and disambiguate the use of this term and related concepts.
Directed Acyclic Graphs (DAGs)
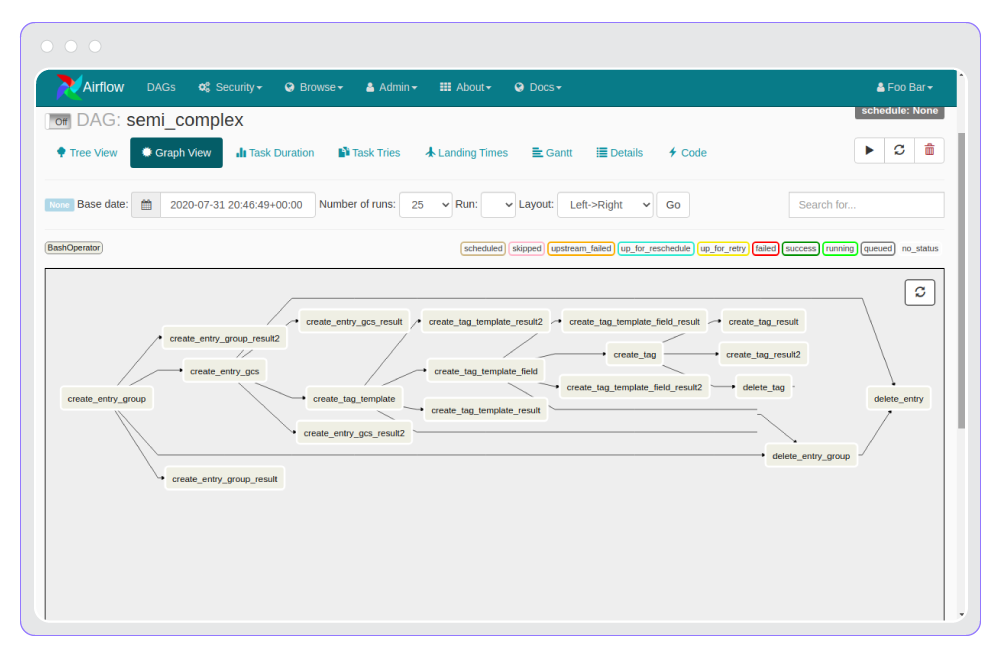
This post is not about data pipeline tools as such, but I would say most modern day Data Engineers are at least loosely familiar with the concept of DAGs given its widespread adoption in pipeline orchestration tools like Apache Airflow and Dagster. So, it’s worth providing a more generic/abstract definition that better describes what a DAG is beyond just date pipelines:
- A DAG is a graph where each and every edge is directed, and
- that has no cycles, i.e. is acyclic
DAGs can be found in many contexts beyond data engineering, which is important to keep in mind. Terminology within IT is often already quite idiosyncratic, so when collaborating with technical colleagues (especially software engineers) just keep in mind that their use of the term DAG very likely means something different than anything specific to data engineering.
That being said, DAGs are found all over the place in the field of data engineering, so it’s worth exploring many such instances before further disambiguating hierarchies as a subset of DAGs (which are themselves clearly a subset of graphs more generally).
Queries
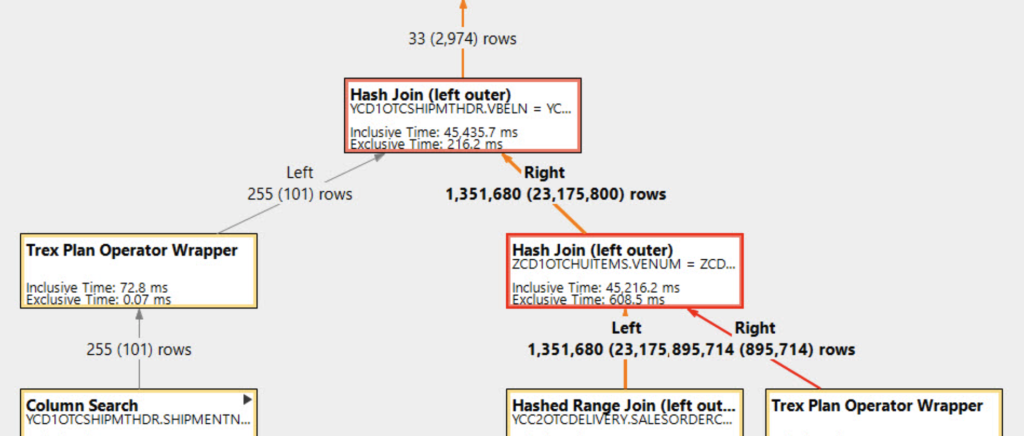
Queries are DAGs. Look at the EXPLAIN PLAN of even the most basic query, and you’ll see that the visualised execution plan is a DAG, where:
- Each node is a particular operation (such as join, filter, aggregate).
- Each edge visualises how the output of a given operation serve as an input to the next operation.
You can clearly see the direction of each edge indicated by the arrows in the plan visualization, and quite obviously a query plan should never have a cycle*, otherwise it would run endlessly until it was stopped or it hit some physical limit.
*Fun fact: On that same project referenced at the beginning of my first post in this series, I did accidentally create a database view in a system that supported column aliases referencing each other within the same projection, and I accidentally created a recursive cycle, i.e. something like A > B, B > C, and then C > A. Querying the view would consume over a terabyte of memory in milliseconds, which led to some very creative debugging! The engineering team then, thankfully, added code to ensure such cycles were prevented. ?)
Data Lineage
Data lineage, which represents the flow of data across a data pipeline, is also a DAG. (What I find interesting to note is that in the case of data lineage, each edge represents a particular operation, and each node represents data. This is the opposite of a query plan, where each edge represents data, and each node represents an operation).

Data Pipelines
Data pipelines are, rather obviously, DAGs.
Gantt Charts
Gantt charts? Aren’t Gantt charts something from project management? Yes, but they’re also used to visualise query plans by displaying the time each operation takes within a query execution plan, by expanding the length of the node to represent the amount of time it takes.
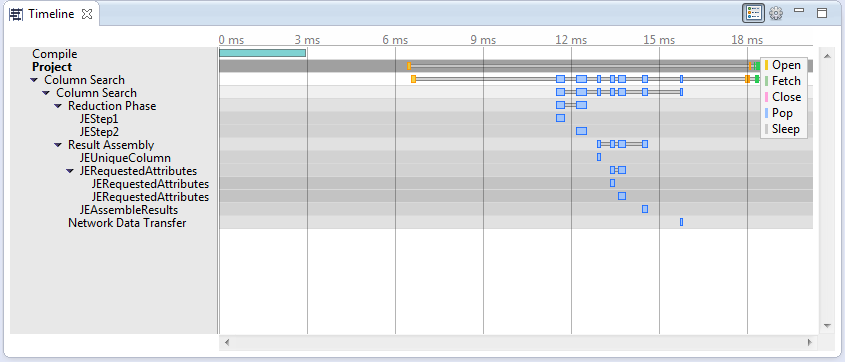
(Side tangent – I’ve always wanted a dynamic Gantt chart visualisation for query plans, where instead of being limited just to a single metric, i.e. time (represented by bar width), I’d have the choice to select from things like memory consumption, CPU time, any implicit parallelization factors, disk I/O for root nodes, etc… any product managers out there want to take up the mantle?)
Relational Data Models
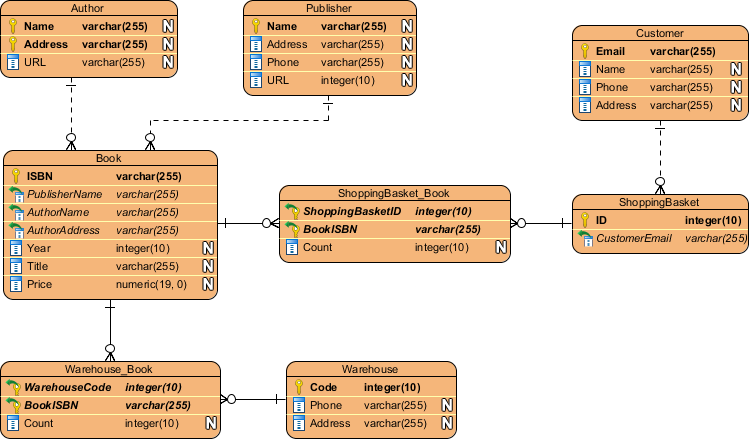
Okay, so, cycles can be found in some real-world relational data models, but even so, all relational data models are directed, and many are acyclic, so I decided to include them here.
- Entities are nodes.
- Primary/foreign key relationships are the edges.
- The direction of the directed edges are from primary keys to foreign keys.
- Clearly large enterprise data models with multiple subject areas can consist of multiple sub-graphs.
And if you’re in the mood for a bit of nuance, it’s absolutely fair to refer to the data model itself (i.e. the metadata) as a DAG, and separately calling out the data itself also as a DAG (i.e. the records themselves and their primary/foreign key relationships).
Hierarchies
Hierarchies are DAGs? Yes, hierarchies are DAGs (and DAGs are graphs – but not all graphs are DAGs – and not all DAGs are hierarchies. In fact, most arent.) Hierarchies will be introduced and discussed in much more detail in the next post, but to give a technical description – a hierarchy can be though of as a DAG where any particular node only has a single predecessor node (often called a “parent” node).
The reality that you should be aware of is that the use of the term “hierarchy”, like most terms in any human language, is often used with a certain amount of ambiguity, which can be frustrating in a technical context when precision is important.
One common example (of many) that illustrates this ambiguity is usage of the term “hierarchy” when describing how database roles in role-based access control (RBAC) can be setup. Consider this language from Snowflake’s documentation around their RBAC model (which is comparable to language from most database vendors with an RBAC model): “Note that roles can also be assigned to other roles, creating a role hierarchy.”
Consider the following diagram from Snowflake’s documentation that, at first glance, does look like a hierarchy:

If you look closely, however, you’ll see that Role 3 inherits two different privileges, which means that this structure, technically speaking is not strictly a hierarchy, but rather is a DAG, since, as we just mentioned above, hierarchies are DAGs for which a given node has only one predecessor node (and in this case, Role 2 has two predecessor nodes).
Now, it’s not really reasonable to say that this categorization is “wrong” because that’s not how language works. The term “hierarchy” means different things in different contexts. However, given that Snowflake is often a component in a larger BI landscape, it is important to disambiguate different senses or meanings of terms like “hierarchy”. In the case of RBAC, use of the term “hierarchy” is short-hand for “a model that supports inheritance” and has little bearing on the use of the term “hierarchy” when it comes to (dimensional) data modeling of heirarchies in the context of data warehousing and BI.
Summary
This is a fairly quick post to summarise:
- DAGs are directed, acyclic graphs
- The common use of the term DAG by Data Engineers is usually limited to the code artifacts of many modern data pipeline/orchestration tools, although it’s clearly a much broader concept.
- Even within the field of Data Engineering, DAGs can be found everywhere, as they describe the structure of things like: query execution plans, data lineage visualisations, data pipelines, and entity-relationship models.
- The terms DAG and hierarchy are often, and confusingly, used interchangeably, despite not representing exactly the same thing. Being aware of this ambiguity can help improve documentation and communication in the context of larger data engineering and BI efforts.
In the next post, we’ll further flesh out the concept of a hierarchy (particularly in the context of BI) including a few examples, a discussion of components of a hierarchy, an introduction to a data model for hierarchies, and a handful of additional considerations.
And for reference, here are links to all of the posts in this series:
Nodes, Edges and Graphs: Providing Context for Hierarchies (1 of 6)
More Than Pipelines: DAGs as Precursors to Hierarchies (2 of 6)
Family Matters: Introducing Parent-Child Hierarchies (3 of 6)
Flat Out: Introducing Level Hierarchies (4 of 6)
Edge Cases: Handling Ragged and Unbalanced Hierarchies (5 of 6)
Tied With A Bow: Wrapping Up the Hierarchy Discussion (Part 6 of 6)


