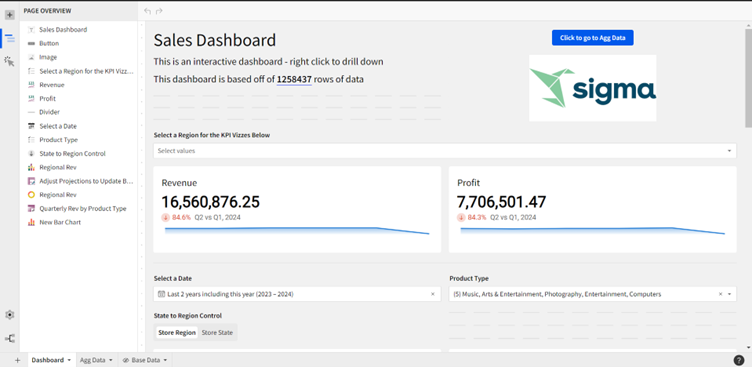
Sigma Computing, a transformative force in the U.S., has now crossed the pond to make its mark in the UK, emerging as a leading-edge cloud-based data visualization tool. This comprehensive exploration delves into the myriad benefits of Sigma and why it stands poised as a formidable contender in the ever-evolving realm of data visualization tools.
Works well with cloud data platforms
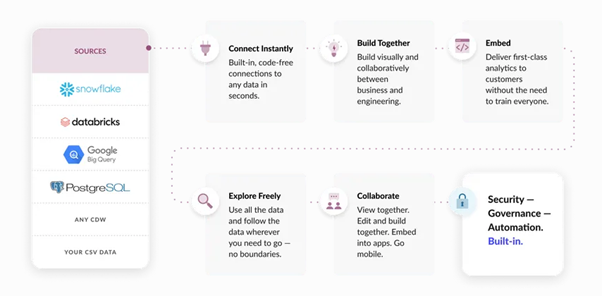
At the core of Sigma’s appeal lies its seamless integration with major cloud data platforms, boasting compatibility with industry giants such as Snowflake, Azure, Redshift, and Databricks. This strategic alignment positions Sigma as a versatile solution that optimizes performance and cost-effectiveness by exclusively relying on cloud data warehouses. The tool distinguishes itself by pushing calculations down to the data warehouse level, eliminating the need for on-premise servers. Notably, Sigma refrains from storing data within the software, opting instead to intelligently cache results. This ingenuity allows users to augment their Snowflake usage by 20-30% without incurring additional credits—a testament to Sigma’s savvy approach to resource utilization.

Interesting Feature: Input tables for ad-hoc scenario modelling
A standout feature in Sigma’s arsenal is the introduction of Input tables, a tool for users engaged in ad-hoc scenario modelling. This functionality empowers users to modify specific cells with different values, providing a dynamic view of how visualizations might evolve. Crucially, this feature ensures that alterations within Sigma do not impact the underlying data within the cloud data warehouse, preserving data integrity. This means you don’t have to download the data into excel to be able to play with the data and analyse.
Easy to use
Ease of use is a cornerstone of Sigma’s design, positioning it as a low-code, user-friendly software solution that intuitively caters to diverse users. The interface mirrors the simplicity of spreadsheets, with everything stemming from a central table within the Sigma workbook. This simplicity extends to the creation of child tables, filters, and various visualizations. Unlike other tools that necessitate intricate coding for calculations, Sigma employs a straightforward notation approach, utilizing expressions like [column 1]*[column 2] for row-level calculations. The platform also offers automatic calculations for time dimensions, covering periods, dynamic rolling 4-week analyses, and relative dates compared to the current day.

Speed and collaboration
Speed is a critical factor in data visualization, and Sigma excels in this domain by virtue of not storing data directly within the software. Instead, as a web browser-based application, it provides swift access to reports from anywhere with an internet connection. This real-time accessibility sets Sigma apart from competitors like PowerBI, allowing users to collaborate seamlessly on the same workbook—reminiscent of the collaborative features seen in Google Sheets. This real-time collaboration eliminates the need for cumbersome email exchanges, streamlining workflow and enhancing overall productivity.

Costing
Cost considerations play a pivotal role in the adoption of any software, and Sigma is strategically positioned for large organizations. Viewer access is entirely free, with costs limited to a platform fee and charges for content creators. This pricing model caters to organizations where sharing data with clients or partners is integral to day-to-day operations. A case in point is DoorDash, the American equivalent of Deliveroo, which leverages Sigma as its data visualization tool. DoorDash utilizes Sigma to share reports with all restaurants on its app, incurring no additional expenses for viewer licensing—a testament to Sigma’s cost-effective approach for data-sharing businesses.
In conclusion, Sigma Computing emerges not only as the newest data visualization tool but its strategic alignment with major cloud data warehouses, coupled with innovative features, user-friendly design, and cost-effective pricing, positions Sigma as a key player in the dynamic and ever-expanding field of data visualization. As organizations continue to navigate the complex landscape of data management and analysis, Sigma Computing stands as a beacon of efficiency, collaboration, and forward-thinking solutions. As Sigma gains prominence in the U.S., its entry into the UK market signifies a potential shift in the landscape of data visualization tools. The tool’s adaptability to diverse cloud data warehouses, coupled with its innovative features, positions it as a robust solution for organizations seeking an efficient, user-friendly, and cost-effective data visualization platform.


