Navigating any Data Vis tool for a high-stakes client, with sky-high expectations can be daunting. You’re staring at a blank canvas, knowing you need to deliver insights that impress, but where do you start? For many of us, the challenge is not just building the report, but doing it efficiently without sacrificing quality.
The good news? With the right techniques, you can turn those daunting first steps into a well-oiled process. These 10 tips will help you streamline your Power BI workflow, saving time in both development and delivery, while ensuring your reports are polished, professional, and impactful.
1. Leverage Keyboard Shortcuts for Efficiency
Tip: Use shortcuts like Ctrl + Shift + F to open the Fields pane and Ctrl + Shift + C to copy visual formatting across visuals. Keeping your desktop view clean by showing only the necessary tabs can significantly enhance your workflow, allowing you to focus on building and refining visuals efficiently.
Why It Works: Shortcuts reduce reliance on menus, speeding up repetitive tasks and improving productivity.
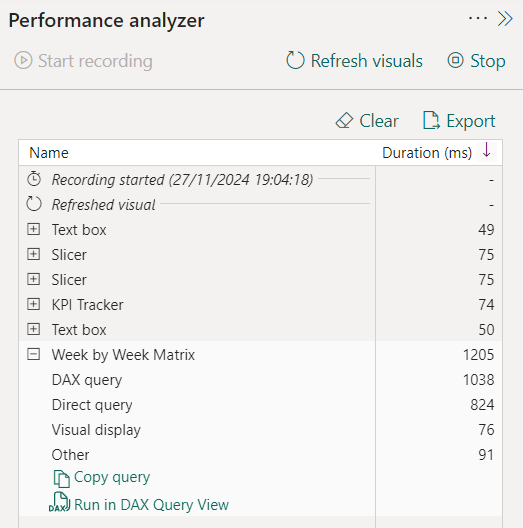
2. Use Performance Analyzer to Optimize Reports
Tip: Identify bottlenecks with the Performance Analyzer, which reveals rendering times and query details. To go the extra mile, copy your query into DAX Studio, to analyse the slowest queries, calculations, and statements within your dashboard.
Why It Works: Pinpointing slow visuals or inefficient DAX measures helps you optimise performance for faster report delivery.

3. Utilise Query Dependencies for Troubleshooting
Tip: The Query Dependencies view provides a clear, visual map of how tables, queries, and data sources are interconnected. It simplifies diagnosing issues by highlighting problem areas in the data flow and helps you understand relationships in complex models. This saves time by allowing targeted adjustments without disrupting downstream queries.
Why It Works: Visualising relationships saves time spent on debugging and ensures smoother model management, especially if you are new to or unfamiliar with the data model you are working on.
4. Sync Slicers Across Pages
Tip: Sync slicers to apply filters across multiple pages with one click.
Why It Works: It ensures a smoother user experience by allowing filters to persist across pages, reducing friction for users navigating complex reports.

5. Create Templates for Consistency
Tip: Design templates with pre-configured layouts, themes, and formatting for standardising reports. Saving a theme in Power BI can also be shared with your stakeholders, allowing you to drive brand identity across an entire organisation.
Why It Works: Templates ensure uniformity and save time, especially when building reports with recurring structures.

6. Use Pre-built DAX Function
Tip: Simplify calculations with functions like TOTALYTD(), DATESYTD(), and USERELATIONSHIP(). These are particularly powerful when referencing related surrogate keys (SKs) from large FACT and DIM tables.
Why It Works: Pre-built functions reduce the need for custom code, minimizing errors and accelerating development.
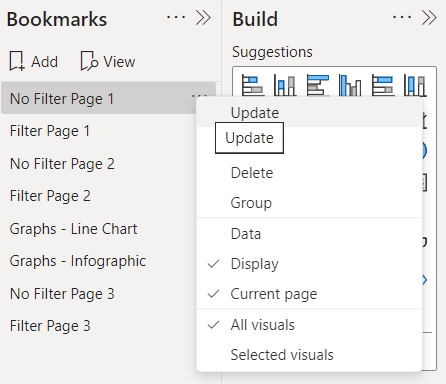
7. Simplify Views with Bookmarks
Tip: Use bookmarks to toggle between different report views, such as a high-level summary and a detailed analysis. You can also create interactive elements, like buttons, to switch between views seamlessly, enhancing user experience and navigation.
Why It Works: Bookmarks enable dynamic storytelling, allowing users to explore data from multiple perspectives without overwhelming them. They also save time by reducing the need to replicate visuals for different scenarios, keeping your reports streamlined and efficient.

8. Speed Up Data Loads with Incremental Refresh
Tip: Refresh only new or updated data using incremental refresh instead of reloading the entire dataset.
Why It Works: Incremental refresh significantly reduces load times, especially for large datasets.
9. Stick to a Star Schema for Better Performance
Tip: Separate fact and dimension tables in a star schema, and avoid many-to-many relationships.
Why It Works: A simpler schema improves query performance, making development and debugging more efficient.
10. Streamline Collaboration with Delivery Frameworks
Tip: Develop delivery frameworks with pre-defined visuals, filters, and formatting tailored to stakeholders’ needs. For example, you can create a 16:9 template in Microsoft PowerPoint, save it as an .svg file (optimised for picture quality), and import it into Power BI as a report background. This approach aligns visuals with stakeholder expectations and streamlines the design process.
Why It Works: These frameworks simplify report finalisation and foster alignment across teams, ensuring faster, professional-grade delivery.
By incorporating these tips into your Power BI workflow, you’ll accelerate development and deliver polished reports with ease. Power BI is a robust tool, and mastering these efficiencies can elevate your data storytelling.
What are your go-to Power BI tips?
Useful Links & Sources:
Keyboard shortcuts in Power BI Desktop – Power BI | Microsoft Learn
How to Use Performance Analyzer in Power BI – Zebra BI
How to Use DAX Studio for Power BI | Hevo
How Query Dependencies Work In Power BI – Master Data Skills + AI
BIBB | Power BI Theme Generator

