Whilst a ‘Lakehouse’ might sound like something out of a Nordic real estate brochure, we’re actually referring to ‘Data Lakehouses’ – the emerging technology in analytics.
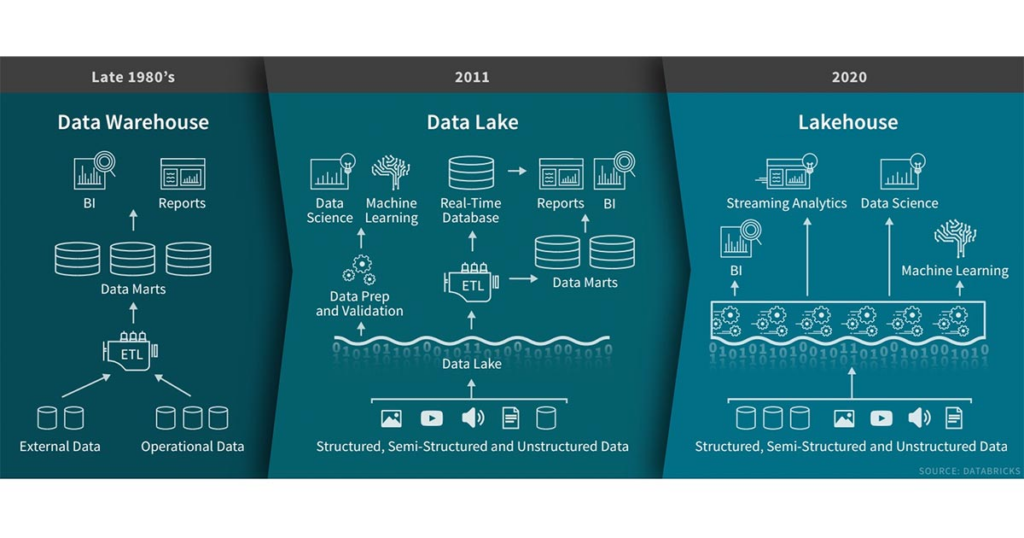
The evolution of the Data Lakehouse all started with Data Warehouses which have been around since the 70’s when Inmon coined the term ‘Data Warehouse’. The Data Warehouse was designed to store numerous disparate data sets within a single repository ensuring that there is a single version of the truth for organisations. These data warehouse solutions are highly structured and governed, but typically they became extremely difficult to change and started to struggle when the volumes of data became too large.
Technology continued to evolve, and organisations started to have an exponential increase in the amount of data that they were creating as a result. This data that was being created by new applications was frequently produced in a semi-structured or unstructured format in continuous streams which is very different to the structured data from transactional systems that data warehouses were used to dealing with. For example, the Internet of Things (IoT) has meant that there are a huge number of devices that are continually creating sensory data such as smart draught pumps in pubs which automatically order new beer deliveries when the keg starts to run out!
This change in data meant that organisations had to adapt their data solutions. Around 10 years ago organisations started to create Data Lakes built using platforms such as Hadoop. Whereas Data Warehouses typically would only store the data that was needed for reporting in a highly structured format, Data Lakes were able to store all data possible but in its raw unstructured or semi-structured format. However, this lack of data quality and consistency often means that it is very difficult to use this data effectively for reporting which has seen much of the promise of Data Lakes unable to be realised (see our blog on ‘Data Swamps’). In addition, these Data Lakes, due to their lack of consistency, also struggled with a lack of governance and functionality compared to Data Warehouse solutions. To deal with this dilemma, lots of organisations typically have a data landscape with a data lake in combination with several data warehouses to help them meet their analytics needs. These extra systems have made the data landscape unnecessarily complex, with data frequently having to be copied between the data lake and the data warehouse.

Enter the ‘Data Lakehouse’ – technologies which provide both the benefits from traditional Data Warehouses in combination with the huge amounts of cheap storage utilised for Data Lakes which has only been possible with the advancement of cloud technology. There are several key features of a Data Lakehouse, however perhaps the most important of these is the ability to natively support both structured and semi-structured data. Snowflake, for example, has a native ‘Variant’ data type which means that you can load semi-structured data such as JSON, XML and Avro straight into the Data Lakehouse, whilst also providing SQL extensions to query this semi-structured data directly. The result is that it’s easy to store fully ACID compliant transactions commonly used in management reporting solutions alongside semi-structured data provided by streaming applications. Data Lakehouses also provide the auditability and governance that was clearly lacking in Data Lake solutions supporting traditional modelling techniques such as Star and Snowflake schemas. Lastly, by storing all of their data in one central data hub it reduces both the complexity of their technical landscape as well as reducing the cost as they don’t need to be storing data in both the data warehouse and the data lake (for more details, see our blog ‘Better, Faster, Cheaper”).
Data Lakehouses are the start of a really exciting new era in the world of data and analytics, offering a huge competitive advantage to organisations. Companies can finally use the huge amounts of data that they have started to create, being able to effectively use it in analytics and reporting to drive new insights and ultimately take better decisions.

